HBIS · Product overview
Hotel business intelligence, built by hoteliers
Four Power Bi products plus FirstLight. Used by 200+ hotels.


01 / 05
Hotel Bi
Every report, no PMS exports
Pace, pickup and booking curves for one hotel or a whole portfolio, straight from your PMS.
- Last year, always there. Every figure against STLY and last year’s final.
- Know who books. Market, nationality, agent or room type in one click.
- See how months fill. Booking curves and lead time against last year.
DataYour PMSForRevenue managersReplacesPMS exports in Excel
Full Hotel Bi page →Pace report: occupancy on the books 89% for August (STLY 82%, final last year 94%), 62% for September (STLY 48%, final LY 78%) and 31% for October (STLY 36%, final LY 64%). Net pickup in the last 7 days: 314 room nights, 16% less than the prior week; Thursday was the strongest day.
All propertiesOn the books vs STLY and final LY
Budget report: revenue €4.18M against a budget of €4.35M, 96.2% of budget (3.8% behind). Occupancy 78.4% this year against 72.2% at the same time last year and 81.0% final last year. ADR by month from April to September, ahead of STLY every month.
All propertiesActual vs budget and STLY
- TY78.4%
- STLY72.2%
- Final LY81.0%
Lead time report: guests book 42 days ahead on average, 5 days earlier than the same time last year. Most bookings arrive 15 to 30 days after booking. Channel mix: direct 52%, OTA 24%, tour operators 16%, corporate 8%.
All propertiesDays from booking to arrival vs STLY
02 / 05
Payroll Bi
Payroll reporting, fully automated
Labour cost by department and hotel, against last year.
- Executive summary. Cost, employees and working days against last year.
- Department analysis. Payroll cost by department, side by side.
- HR analytics. Hires, terminations, absence rate and headcount.
DataPYLON HRMForHR and financeReplacesPayroll files in Excel
Full Payroll Bi page →Executive overview: total cost €684,220, up 8.4% on last year. Average gross pay €1,842, up 2.1%. 82 active employees, 4 more than last year. Labour cost 31.2% of revenue, 1.8 points under budget. Monthly cost peaks in July at €171K.
All propertiesThis year vs last year
Departments report: year-to-date labour cost by department. Rooms €238K, F&B service €198K, kitchen €144K, admin €104K. Labour cost is 31.2% of revenue against a budget of 33.0%.
All propertiesLabour cost by department, year to date
Headcount report: 82 active employees in July, 4 more than last year. Hiring peaks in April with 42 hires. Average gross pay €1,842, up 2.1% on last year.
All propertiesStaff and turnover vs last year
03 / 05
ERP Bi
Your hotel P&L, without spreadsheets
Your ERP accounts as a hotel P&L for every property. It runs in your own Microsoft Azure.
- Your own P&L layout. Ledger accounts mapped to the P&L you already use.
- Budget or last year. Every line against the comparison you pick.
- From total to ledger line. Drill by hotel, cost centre or account.
DataERP, PMS and payrollForFinance teamsReplacesThe monthly Excel P&L
Full ERP Bi page →Budget vs actual: actual revenue year to date €3.90M, 10.4% behind the year-to-date budget of €4.35M (full-year budget €5.10M), so 89.7% of budget achieved. GOP margin 34.6%, up 2.1 points on last year. July is the strongest month at €630K.
All propertiesYear to date vs budget
Profit and loss: year-to-date variance against budget by line. Rooms plus 4.8%, F&B minus 4.3%, spa and other plus 15.3%, payroll minus 2.6%, cost of sales plus 8.3%. Revenue mix: rooms €2.41M, F&B €842K, spa and other €196K, events €152K.
All propertiesP&L lines, year to date vs budget
Margin report: GOP margin year to date 34.6%, up 2.1 points on last year. By month the margin rises from January to a high of 44% in July and is ahead of budget from March to September.
All propertiesGOP margin, actual vs budget
04 / 05
F&B Bi
Every outlet in one report
Sales, covers and spend per guest for every restaurant and bar, straight from your POS.
- Know what sells. Revenue, volume and price for every item.
- See your busiest hours. Orders by day and hour for each outlet.
- F&B linked to rooms. RevPOR shows spend per occupied room.
DataPOS and inventoryForF&B managersReplacesPOS reports, one outlet at a time
Full F&B Bi page →F&B summary for June: total revenue €842,310, up 12.6% on the same time last year. 26,904 covers, up 9.8%. Average cover €31.30, up €1.10. Revenue per occupied room €71.20, up 3.4%. Revenue by month from April to September peaks in July at €1.09M.
All propertiesJune · all outlets vs STLY
Outlets report for June: covers by outlet, main restaurant 11.2 thousand, pool bar 6.4 thousand, beach club 5.0 thousand, lobby bar 2.6 thousand, room service 1.6 thousand. Average cover by date peaks at €48.0 on 12 June.
All propertiesCovers and average cover, June
Peak hours report: a heatmap of orders by day and hour, 11:00 to 23:00. The busiest hour is 22:00, with the single busiest slot on Thursday at 22:00. 13:00 is the second-busiest hour and Sunday is the busiest day.
All propertiesOrders by day and hour
05 / 05
FirstLight
Know what changed in your hotel before your first coffee.
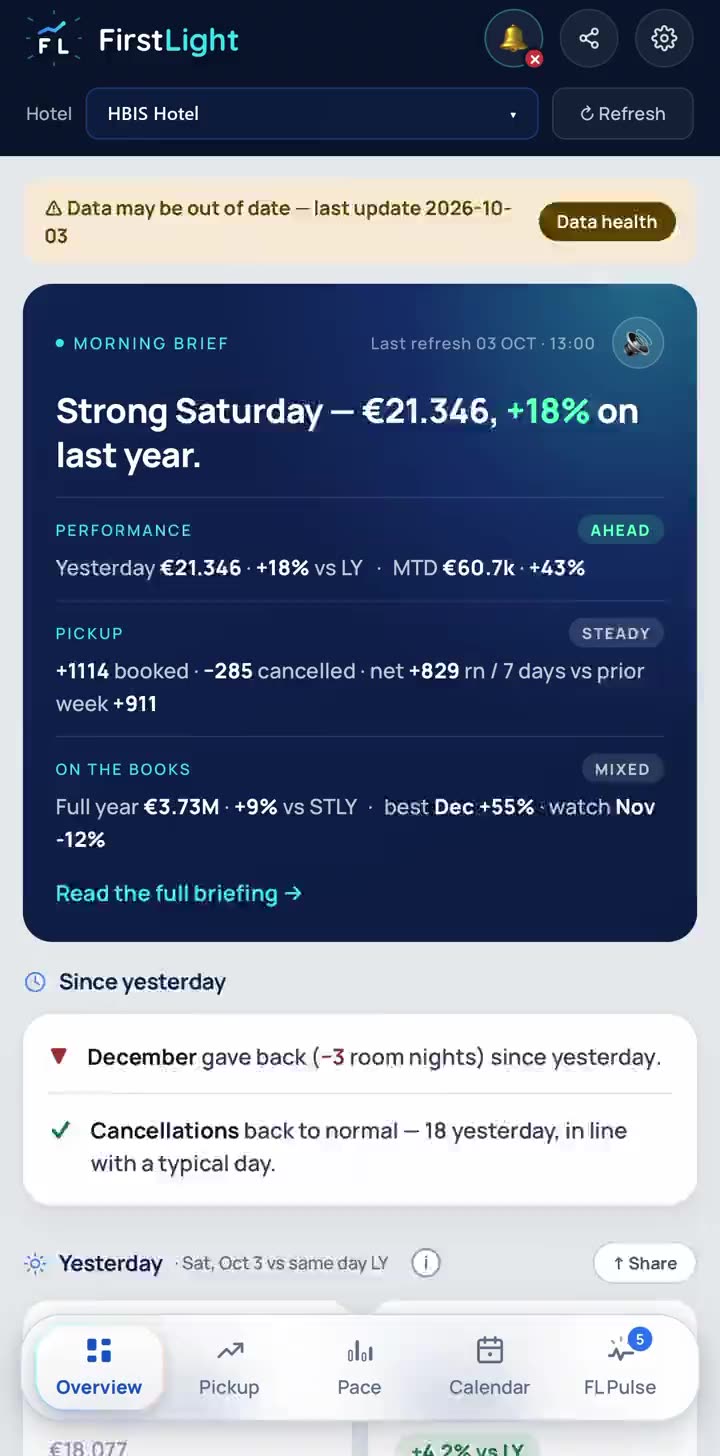
FirstLight reads your PMS every night and briefs you every morning.
- Morning summary. Yesterday and the month so far. Tap to listen.
- Smart alerts. A push only when it matters.
- Share in one tap. Send any section to WhatsApp as a clean image.
Works withAny PMSPlanIts own subscription
Full FirstLight page →
Clients
Trusted by 200+ hotels
Hotel groups

Hotels and resorts

Hotel management companies
Short-term rental managers

“By choosing the full HBIS package … we’ve unified reporting across all departments.”
We are hoteliers. See HBIS with your own data.
Every HBIS system was built and tested in hotels.